Short Read
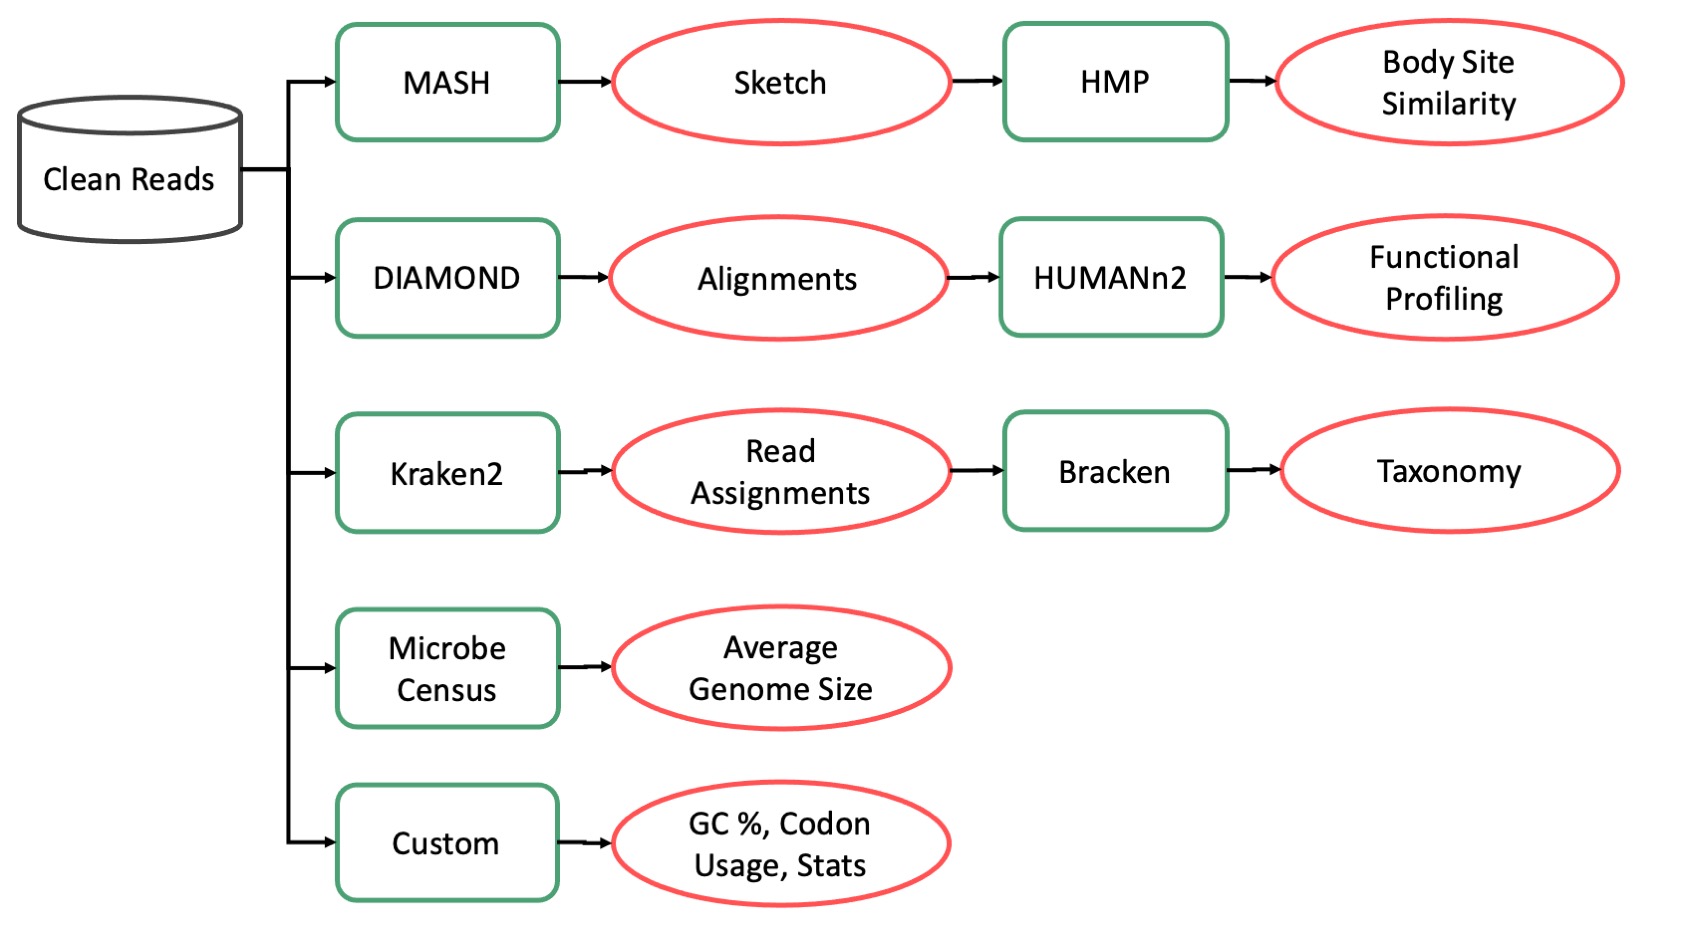
The short read pipeline analyzes unassembled sequencing data to generate a number of useful scientific results including taxonomic profiles and functional profiles. This pipeline runs on data that has been preprocessed using the preprocessing pipeline.
Modules
Kraken2 Taxonomic Profiling
This module generates taxonomic profiles for each sample using Kraken2. Taxonomic profiles record how many reads in a sample can be confidently assigned to a set of microbial taxa. These profiles can be fed into downstream techniques to infer the relative abundance of different species in a sample or set of samples. For most microbiome studies this information underpins the rest of the results.
A number of different taxonomic profilers exist. Kraken2 is used because it is relatively resource efficient and performs well on most accuracy benchmarks. In the CAP Kraken2 is used with a large database containg all microbial genomes from RefSeq.
Kraken2 produces two files. A report file that summarizes the number of reads assigned to each taxa (and some diagnostic metrics) and a read assignment file which details what clade each read mapped to. An example of the output files from this module may be found on Pangea.
Functional Profiling
This module identifies the abundance of microbial metabolic pathways using HUMAnN. These profiles are called functional profiles and are generally used for inferring what metabolites a microbiome can process and produce. The module works by first aligning reads to UniRef90 using Diamond then by processing the resulting reads with HUMAnN.
Diamond produces one file as output: an M8 format blast tabular file. An example of the output file from Diamond may be found on Pangea.
MASH Sketching
MASH. generates small sketches of sequencing data that can be used to quickly identify similar samples in an unbiased way. Mash sketches are based on finding a pre-set number of minimized kmers in a sample and finding the overlapping minimizers between two samples.
This module produces two output files: a small MASH sketch with 10,000 minimized k-mers and a large sketch with 10,000,000 minimized k-mers. An example of the output files from this module may be found on Pangea.
Jellyfish K-mer Counting
Jellyfish. counts the number of times each k-mer occurs in a sample to produce a k-mer profile. These profiles are useful to compare samples in an unbiased way and to search for particular sequences.
By default the CAP counts canonical 31-mers and 15-mers. All k-mers, including singletons, are counted. K-mer counting occurs after error correction which substantially reduces the number of singletons compared to raw data.
Jellyfish produces two output files, both jellyfish archives (a custom format supported by jellyfish), one for 15-mers and one for 31-mers. An example of the output files from this module may be found on Pangea.
